
Executive Summary
As we transition into 2025 under a new federal administration, significant shifts are unfolding across the GSA landscape. These changes include aggressive initiatives: contract terminations, SIN reductions, GPC card restrictions and millions of rumors around these.
While speculation circulates regarding internal budget constraints and procurement slowdowns, our focus today is a fact-based assessment of Q1 2025 GSA Advantage sales performance using FOIA-obtained data. This analysis compares the January–March 2025 results with historical Q1 performance and offers insights across agency spending, SIN trends, manufacturer activity, and broader systemic changes.
- Total GSA Advantage Sales: Year-over-Year Q1 Comparison
- Monthly Breakdown
- Top Federal Agencies by Q1 GSA Advantage Spend
- Top SIN Performance – Q1 Comparison
- Manufacturer Trends
- GSA MAS Contract Award Trends
- GPC Card Update (via DOGE FOIA)
- Final Thoughts
Total GSA Advantage Sales: Year-over-Year Q1 Comparison
(Sales in $ Millions; GSA Advantage platform only; excludes eBuy, phone/email/fax orders)
| Period | Avg 20–23 | 2024 | 2025 |
| Total Q1 | $136M | $129M | $101M |
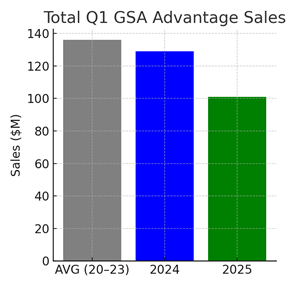
- The 2024 Q1 dip was largely attributed to the delayed federal budget passage, which triggered a record Q2 spike.
- Q1 2025 marks a 21% decline vs. 2024 and a 26% drop vs. the 4-year average (20-23), signaling continued suppression in federal Q1 purchasing.
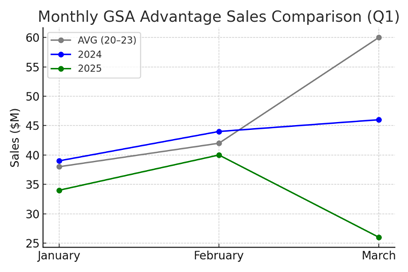
Monthly Breakdown
- March 2025 experienced the steepest drop, likely correlated with GPC card deactivations announced in late February.
Top Federal Agencies by Q1 GSA Advantage Spend
(Only agencies with >$1M in Q1 2024 or 2025)
| Agency | 2024 | 2025 | Δ ($M) | Δ (%) |
| Department of the Air Force | $52M | $41M | -$11M | -21% |
| Department of the Navy | $14M | $9M | -$5M | -36% |
| Department of the Army | $11M | $8M | -$3M | -29% |
| Department of Veterans Affairs | $11M | $14M | +$3M | +29% |
| Department of Agriculture | $9M | $6M | -$3M | -33% |
| Department of Defense | $8.5M | $6M | -$2.5M | -29% |
| Department of Homeland Security | $4.4M | $3.6M | -$0.8M | -18% |
| Department of HHS | $2.6M | $1.4M | -$1.2M | -48% |
| Department of Justice | $2.4M | $1.4M | -$1M | -42% |
| Department of Treasury | $2M | $1.5M | -$0.5M | -26% |
| Department of Interior | $1.9M | $1.3M | -$0.6M | -30% |
| U.S. Army Corps of Engineers | $1.8M | $1.2M | -$0.6M | -35% |
| Department of Commerce | $1.4M | $1M | -$0.4M | -30% |
| Department of Energy | $1.2M | $0.7M | -$0.5M | -43% |
| Department of State | $0.95M | $1.01M | +$0.06M | +6% |
- The VA is the only agency showing a significant increase in spending this quarter. This may present a strategic opportunity to assess your eligibility for a VA-specific contract.
- Air Force remains top spender despite the largest dollar decrease.
- Notable percentage declines: Justice, Energy, and HHS.
Top SIN Performance – Q1 Comparison
(Only SINs with >$1M in 2024 or 2025)
| SIN Name | SIN # | 2024 | 2025 | Δ ($M) | Δ (%) |
| Purchasing of New Electronic Equip | 33411 | $30M | $23M | -$7M | -22% |
| Hardware Store | 332510C | $26M | $22M | -$4M | -16% |
| Office Products | 339940 | $12M | $9M | -$3M | -23% |
| OS4 Office Supplies | 339940OS4 | $8.3M | $5.8M | -$2.5M | -31% |
| Law Enforcement Equipment | 332999 | $3.3M | $2.9M | -$0.4M | -12% |
| Office Furniture | 33721 | $1.9M | $1.3M | -$0.6M | -30% |
| Laboratory Equipment | 339113LAB | $1.62M | $1.69M | +$0.07M | +4% |
| Analytical Instruments | 334516 | $1.55M | $1.3M | -$0.25M | -16% |
| Physiotherapy Apparatus | A-70 | $0.15M | $1.22M | +$1.07M | +683% |
| Photographic Supplies | 333316P | $1.5M | $0.8M | -$0.7M | -45% |
| Diagnostic/Testing Equipment | 334515 | $1.2M | $0.7M | -$0.5M | -41% |
| Clothing | 3152 | $1.01M | $0.95M | -$0.06M | -6% |
| Packaging Materials | 3PACK | $1.22M | $1.16M | -$0.06M | -5% |
- The increase in VA spending is primarily driven by VA SIN A-70 (Physiotherapy Apparatus).
- The remaining top SINs remain largely consistent with the rankings from the October Yearly Report. Purchasing of New Electronic Equipment, Hardware Store items, and Office Supplies continue to lead in overall sales.
- However, Photographic Supplies and Diagnostic, Measuring, and Testing Equipment have shown a weaker performance to start the year.
Manufacturer Trends
| Manufacturer | 2024 Sales | 2025 Sales | Δ ($M) | Δ (%) |
| AbilityOne | $7.7M | $5.8M | -$1.9M | -25% |
| Hewlett-Packard (HP) | $6.5M | $3.8M | -$2.7M | -41% |
| 3M | $2M | $1.6M | -$0.4M | -19% |
| Samsung | $1.9M | $1.3M | -$0.6M | -31% |
| Lexmark | $1.8M | $1.3M | -$0.5M | -28% |
| Cisco Systems | $1.2M | $1.0M | -$0.2M | -16% |
| Dell | $1.2M | $0.8M | -$0.4M | -37% |
| Physiohab (NEW) | – | $1.0M | +$1.0M | NEW |
- A notable new entrant under VA SIN A-70 is Physiohab, primarily offering therapy devices and orthopedic braces.
- The remaining top manufacturers have retained their positions, with most experiencing similar declines in sales. AbilityOne, HP, and 3M continue to lead in overall volume.
GSA MAS Contract Award Trends
| Month | 2024 | 2025 | Δ |
| January | 118 | 133 | 15 |
| February | 118 | 143 | 25 |
| March | 168 | 170 | 2 |
- MAS contract approvals remain steady, showing no slowdown despite internal consolidation.
GPC Card Update (via DOGE FOIA)
April 15th, 2025
The federal audit initiative targeting unused or unnecessary government purchase and travel cards has now expanded to 30 agencies. 468,243 cards have been deactivated or limited to $1, keeping 295,151 cards alive with limit >1$.
Final Thoughts
Whether you view these developments optimistically (“sales continue, MAS contracts are growing”) or pessimistically (“GPC deactivations, staffing cuts, and contract terminations”), the federal procurement landscape is clearly entering a pivotal transformation.
Key Recommendations for Contractors:
- Maintain full MAS compliance.
- Proactively manage Order Management and Scorecard performance.
- Communicate with your CS/CO regularly.
- Stay alert to emerging agency trends and spending shifts.
Let’s remain adaptive, strategic, and compliant as we navigate this historic evolution in GSA operations.