Key findings
- PriceReporter secures more than 40 IDIQ contracts and more than 20 BPAs a year for clients, averaged over the past five years — about one negotiation reaching award every seven to ten days.
- The annual award count covers 20+ standard MAS offers, 10+ Streamlined offers, 5+ VA Federal Supply Schedule contracts, 3–4 joint ventures and 20+ BPAs across federal programs.
- On the $1.3 billion GSA MRFS2 BPA, more than half of the awarded companies are PriceReporter clients, including clients carried through the transition from MRFS Generation 1.
- On the $2.3 billion GSA OS5 Requisition Channel BPA, 2 of the 5 awards went to PriceReporter clients; on DLA FedMall, 3 awards.
- PriceReporter crossed 1,000 company clients in 2024; the base is roughly one large business for every ten small ones and includes eight Fortune 500 companies.
- Clients processed more than $1.5 billion in federal and SLED business through the PriceReporter order management system in 2026 to date — over $4 million on an ordinary day and more than 1 million orders a year.
- The average GSA Advantage micro-purchase order through the PriceReporter system is $536, against a $326 average order on the GSA Commercial Platforms Program (FY25).
- About 60% of orders settle by credit card at the moment of purchase; the remaining 40% arrive on NET30 terms, by wire or by check, across 10 supported payment gateways.
- August and September carry more than 25% of annual dollar volume — a pattern that has held every year for five years without exception.
- The OMS runs 50+ live integrations: 15 order-receiving modules, 27 PO-fulfillment modules and 10 payment gateways; open-market and client-owned channels average about 5% of volume, with some clients near 50%.
- Three vehicles are in progress: DLA TLS ($10B, 10 years, 1 of 7 positions, submitted), DLA ECAT medical supplies ($6B, 5 years) and GSA OASIS+ ($10B+, no ceiling, 7+ years).
- PriceReporter expects to phase out EDI uploading to GSA entirely in early 2027 if GSA continues transitioning contracts to the FAS Catalog Platform (FCP).
Why we are publishing this
Most firms in this business treat their numbers as a trade secret. Award counts, client volume, capture records: these stay behind the curtain because a competitor who sees them learns exactly where you are strong and where you are thin, and because a firm without impressive numbers is better off saying nothing at all.
We have decided, for once, to share some of ours.
Everything here is aggregate. We are not naming clients, and nothing in this report gives away anyone's contract position or pricing. What you get instead is the shape of the operation: how many contracts we win in a typical year, how our clients have done on the biggest vehicles in federal supply, who those clients are, and how much business runs through our systems on an ordinary day.
We are publishing it for two kinds of reader. A company weighing whether to work with us deserves something more than assertions about capability, and the honest way to answer how good are you at this is to show the volume and let the reader judge. And anyone simply curious about how this part of the federal market operates will find real numbers here rather than adjectives.
Executive summary
Three figures carry an average year.
What connects them is not scale for its own sake. It is that the same team negotiating the contract also runs the system the resulting orders flow through, so the compliance decisions made at award are enforced automatically at transaction time.
Who the clients are
In 2024 PriceReporter crossed 1,000 company clients. The base has kept growing since.
The client base is predominantly small business, which is what the federal supply market looks like, but not exclusively so: roughly one large business for every ten small ones, including eight Fortune 500 companies.
That mix matters more than either number alone. A firm serving only small businesses never encounters the compliance and reporting demands a large enterprise brings, and a firm serving only large enterprises loses the volume and variety that comes from running dozens of smaller contracts at once. PriceReporter does both, on the same systems.
What an average year looks like
Five-year look back
Averaged across the past five years, the work comes to more than 40 IDIQ awards and more than 20 BPA awards a year, which is about one negotiation reaching award every seven to ten days. The count matters less than the range behind it. In any given year the same team is working medical and surgical supply, office and facility products, industrial MRO, laboratory and scientific equipment, IT hardware, tactical and troop support items, and professional services, for companies that run from a two-person reseller to a division of a Fortune 500. Each category prices differently, each contracting office reads a package differently, and most of what the team knows about moving an offer through came from the difficult cases rather than the clean ones.
What the award count covers
Joint ventures are the hardest of these to file. Two companies' structure, capability and past performance have to present as one coherent entity, which is why three or four a year is a meaningful number rather than a small one.
Where the BPA awards land
PriceReporter prepares complete RFQ responses for clients, including the technical and pricing components of the package. The 20-plus BPA awards in an average year are spread across federal programs of very different sizes. The named programs below are among them, not a full accounting of every award.
| Program | Value potential | Period | PriceReporter client outcome |
|---|---|---|---|
| GSA MRFS2 BPA | $1.3 billion | 5 years | More than half of the awardees are PriceReporter clients, including companies transitioned from MRFS Generation 1 |
| GSA OS5 Requisition Channel BPA | $2.3 billion | 10 years | 2 of the 5 awards went to PriceReporter clients |
| DLA FedMall | $200 million | Ongoing | 3 awards to PriceReporter clients |
| GSA MRO RC3 | $3.2 billion | 10 years | Client packages prepared for the Generation III requisition channel |
| Additional smaller BPAs | $1 million to $10 billion | 1 to 10 years | Client awards across other federal programs, making up the balance of the annual count |
MRFS2 is the result worth dwelling on. More than half of the awarded companies are PriceReporter clients, on a $1.3 billion, five-year vehicle — including clients PriceReporter also carried through the transition from MRFS Generation 1.
Currently in progress
Three vehicles are active work right now, and one of them is the largest PriceReporter has ever taken on.
DLA TLS
$10B10 years · competing for 1 of 7 awardee positionsThe largest vehicle PriceReporter has worked. First submission filed.
DLA ECAT, medical supplies
$6B5 yearsUnderway for medical supply clients.
GSA OASIS+
$10B+7+ years · no dollar ceiling · ~300 companies already awardedA services vehicle spanning eight domains, each qualified for separately. PriceReporter work underway.
| Vehicle | Value potential | Period | Status | Detail |
|---|---|---|---|---|
| DLA TLS | $10 billion | 10 years | Submitted | The largest vehicle PriceReporter has worked. First submission filed, competing for 1 of 7 awardee positions |
| DLA ECAT, medical supplies | $6 billion | 5 years | In progress | Underway for medical supply clients |
| GSA OASIS+ | $10 billion and up | 7+ years | In progress | Already awarded to nearly 300 companies, with no dollar ceiling on the vehicle. PriceReporter work underway |
DLA TLS is the largest single award opportunity of the three, at $10 billion across a ten-year contract life, with seven award positions available. DLA ECAT adds a further $6 billion over five years in the medical supply market.
GSA OASIS+ is the one with no upper bound. More than $10 billion has already been awarded across nearly 300 companies, the vehicle carries no dollar ceiling, and it runs 7 years or more. A position on it is not a fixed slice of a fixed pot, which makes it the most open-ended of the three. It is also a services vehicle rather than a product one, spanning eight domains from Management and Advisory to Logistics and Enterprise Solutions, each qualified for separately.
State, local and education
PriceReporter has secured awards for clients on multi-year, multi-state cooperative IDIQ vehicles. The scale figures below describe each cooperative's own annual purchasing volume, not PriceReporter client volume.
| Cooperative | Annual volume | Reach |
|---|---|---|
| OMNIA Partners | $35 billion and up | Collective purchasing power across roughly 1,000 contracts and more than 600,000 member organizations |
| NASPO ValuePoint | $21 billion and up | Annual spend managed across 62 portfolios and 450+ suppliers, covering all 50 states, the District of Columbia and the territories |
| Sourcewell | $3 billion and up | Annual purchases on Sourcewell-awarded contracts, available to more than 50,000 government, education and nonprofit agencies |
| TIPS | $2 billion* | Lead agency Region 8 ESC in Texas, operating since 2002, more than 4,000 awarded vendor contracts, members in all 50 states |
| BuyBoard | $977 million | Annual purchasing volume across more than 4,800 members, run by the Texas Association of School Boards, with $26 million returned to members in rebates since 2006 |
| Axia Cooperative | $250 million* | Ten lead public agencies including the City of Tucson, County of Orange (California) and Clark County School District, open to all 50 states and the territories |
* TIPS and Axia do not publish volume; these two figures are PriceReporter estimates based on channel activity.
Alongside the cooperatives, contracts held directly with individual states, plus a number of other state- and county-specific contracts.
| State contract | Scale | What it covers |
|---|---|---|
| New York State | $34 billion | Portfolio value across roughly 1,500 OGS centralized contracts available to state agencies and authorized local users |
| Texas MAS | $882 million per quarter | TXMAS lets Texas buyers order off federally awarded schedule pricing. Texas DIR reported $882 million in cooperative contract purchases in a single quarter of fiscal 2026, about $333 million of it from local government |
| Virginia eVA | $245 million | More than 245 state agencies and higher-education institutions and over 900 local governments buy through eVA, with roughly 100,000 registered businesses on the supplier side |
| Delaware MMP | $200 million and up per year | My Marketplace, run by Government Support Services, the exclusive contracting agent for materiel and non-professional services for covered state agencies, with central contracts also open to school districts, municipalities and nonprofits |
The two routes work differently. A cooperative gives a client reach across many jurisdictions from one award, while a state contract gives deeper standing inside one of them, and most clients selling seriously into SLED end up needing both.
These vehicles extend a client's reach beyond federal buyers into state, municipal and school district procurement without a separate acquisition effort for each jurisdiction. For a supplier already holding federal contracts, the catalog, pricing discipline and order handling are largely the same work, applied to a second set of buyers.
The technology layer
The channel in context
FY25 alone accounted for roughly a third of everything the Commercial Platforms Program has handled since FY21, and repeat buyers climbed from 56% to 83%. The channel is accelerating, and buyers who try it come back. The last two figures sit next to each other for context rather than comparison. They are different channels, both micro-purchase federal buying.
The platform has two halves. Order management runs the transactional side, from catalog and inventory through fulfillment and payment. Federal market intelligence runs the analytical side, covering opportunity identification, price optimization, sales data analysis and competitor reporting. A client's own storefront feeds the first and their accounting system closes the loop underneath both.
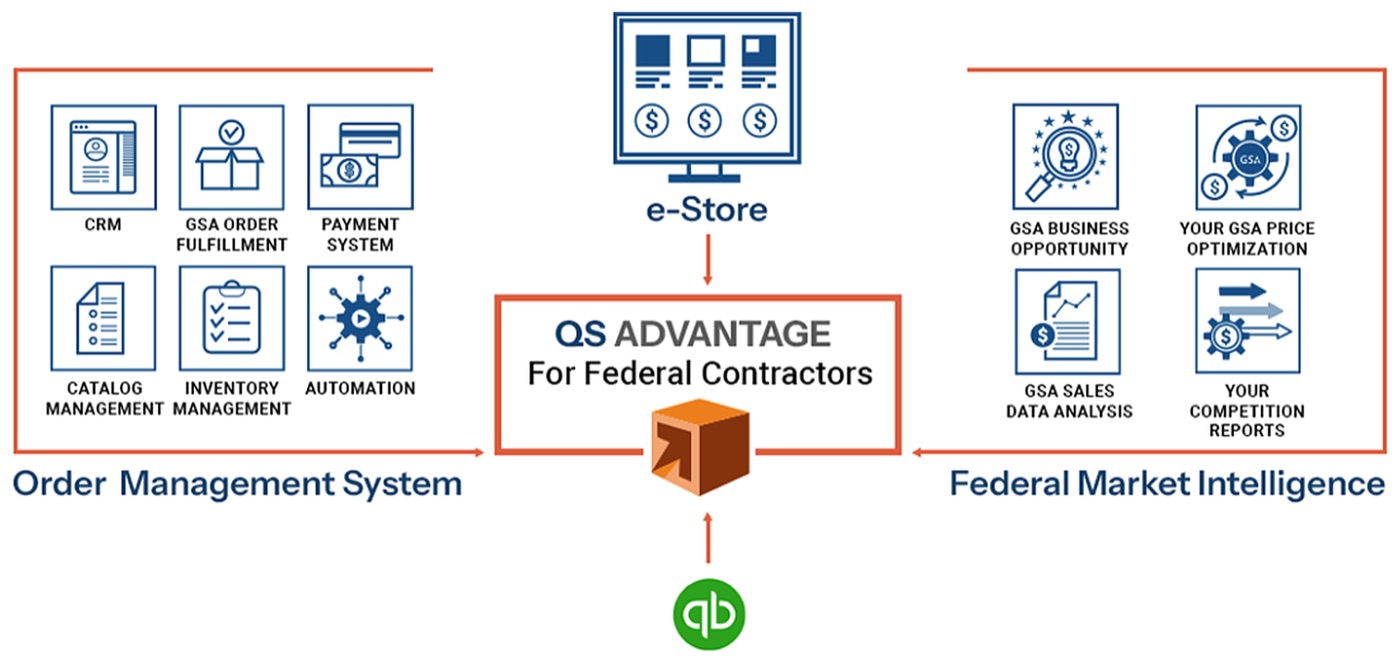
One system for three markets
Clients run their federal, SLED and commercial business inside a single PriceReporter order management system. The following channels are connected directly:
Price integrity by construction
The system holds multiple contracts and multiple price lists per client, and resolves the correct price according to the customer type and the contract that governs the transaction.
Every PriceReporter client has a different contract structure, and most have several running at once. The system enforces the right price at the moment of the order rather than relying on a person to remember which agreement applies. Clients do not overcharge the government, and businesses with genuinely complex structures still produce clean, reportable numbers.
Storefronts the client owns
Client-operated e-commerce takes several forms. PriceReporter supports custom-built storefronts, Shopify implementations, and a PriceReporter-built government portal front end whose content and orders are managed from the same order management system as every other channel.
The value is not only the revenue. A buyer who orders through a supplier's own storefront has a better experience than one navigating a shared marketplace, and the supplier builds brand loyalty that a marketplace listing cannot.
What the system handles
| Measure | 2026 year to date |
|---|---|
| Federal and SLED volume processed | Over $1.5 billion in 2026 to date, and growing |
| Orders handled | More than 1 million a year |
| Volume on an ordinary day | Over $4 million |
| Average order, GSA Advantage micro-purchase channel | $536. The full $1.5 billion includes substantially larger SLED and commercial orders |
| Card versus terms, by order count | About 60% settle by credit card. The remaining 40% arrive on NET30 terms, by wire or by check |
| Payment gateways supported | 10, led by PayTrace and Authorize.Net |
In the moment, at the point of order.
Invoiced and reconciled weeks later against the contract that set the price.
The year is not evenly distributed
August and September carry more than 25% of annual dollar volume. The pattern has held every year for five years, without exception.
Illustrative shape of the federal fiscal year (October–September); August and September highlighted. Not to scale.
The federal fiscal year closes September 30. Unobligated funds do not carry forward, so buyers spend them. A quarter of the year's business lands in a sixth of its days.
Capacity has to be built for that peak, not the average. A catalog error that costs an afternoon in February costs orders in the second week of September. The work that protects the quarter happens in the spring.
Open market and client-owned channels
A growing share of client business now arrives outside the traditional marketplace listing. Open-market government orders reach clients through three routes:
Share of federal and SLED volume arriving through open-market and client-owned channels — and growing.
Some clients now take close to half of their federal and SLED business through their own e-commerce website and open-market activity.
The average understates what is achievable. The 5% figure is an average across a client base at very different stages of building out that channel, not a ceiling.
OMS integration network
Every connection listed here runs into the PriceReporter Order Management System, the OMS. These are order-flow integrations rather than marketing partnerships. Each one moves live purchase orders, catalog data or payment authorizations between the OMS and an outside system, and each is in production for clients today.
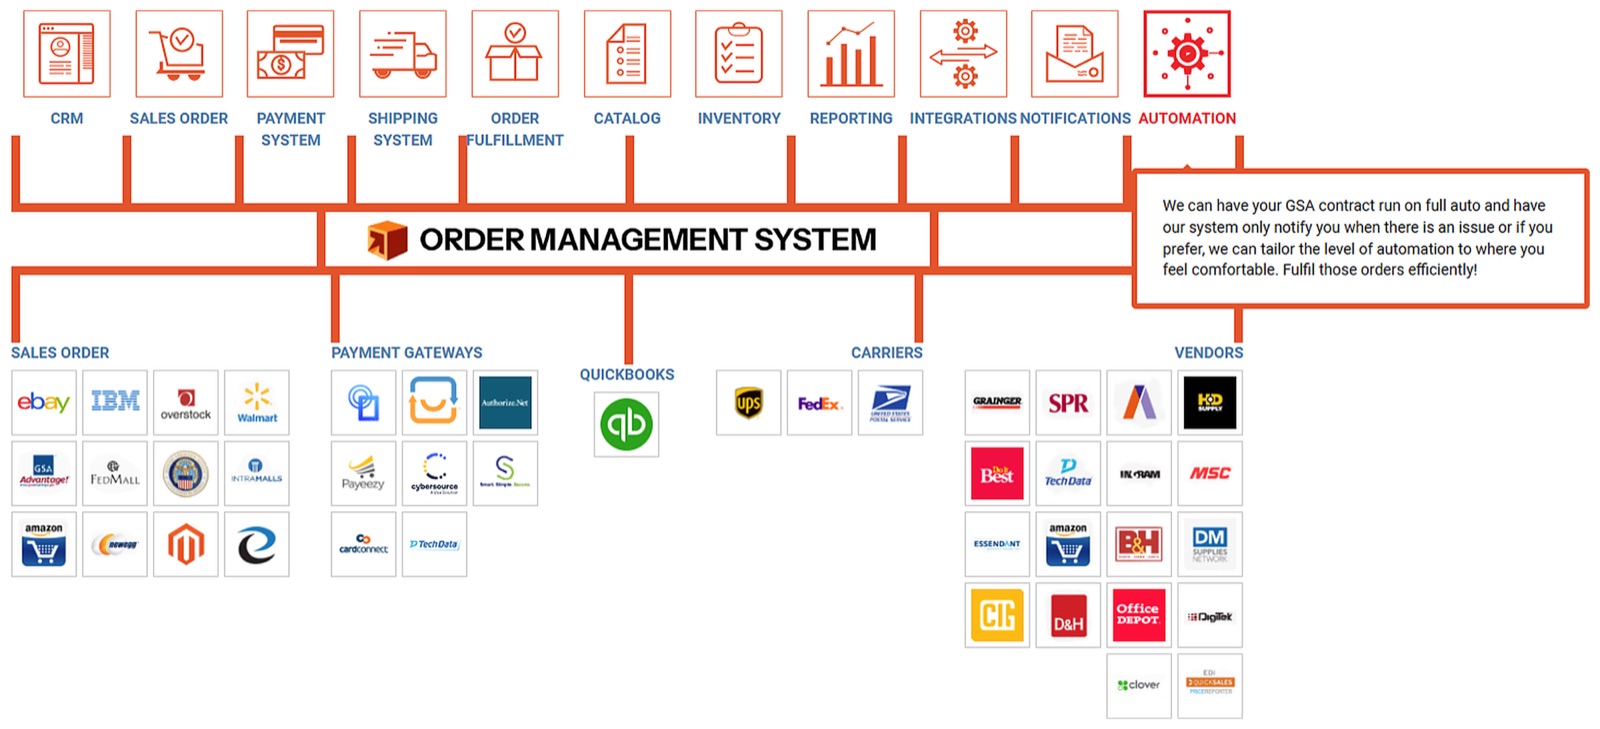
Each new integration removes a manual step between a supplier's catalog and the channel where federal and SLED customers actually place orders. An order that arrives, prices, routes to the distributor and settles without anyone rekeying it is the difference between handling August volume and drowning in it.
The list matters less as a set of names than as a shape: orders can arrive from almost anywhere a government buyer shops, and leave for almost any distributor that fills them, without ever leaving the OMS.
Into the OMS 15
Order receiving modules
Out of the OMS 27
PO fulfillment modules
Settlement 10
Payment gateways
Ten gateways is the count that usually surprises people. Federal and SLED buyers pay by purchase card, by NET30 terms, by wire and by check, and a supplier inheriting a customer base rarely gets to choose which processor that customer already uses. Supporting the processor the client is on is faster than migrating them off it.
Accounting is fully integrated alongside these. Beyond the packaged modules, the system exposes an open API and custom export capability, so a client running something the catalog does not already cover is not waiting on a module to be built before their data moves.
Forward view: the FCP transition
PriceReporter continues to maintain EDI upload capability to GSA because BPA clients cannot yet move to the FAS Catalog Platform. That capability is deliberately retained rather than retired early, because withdrawing it would strand exactly the clients holding the highest-value agreements.
Where these numbers come from
Federal award data is public. Contract and BPA awards, including the companies holding positions on large vehicles, are published on SAM.gov and carried by platforms such as HigherGov and GovTribe, and the solicitations themselves state each vehicle's value and the number of award positions. Many of the companies behind these awards name PriceReporter on their own websites, as we do on ours. Program-level figures for the GSA Commercial Platforms Program come from GSA's own published FY25 program highlights. Cooperative and state program figures come from the operators themselves, published by OMNIA Partners, NASPO ValuePoint, Sourcewell, BuyBoard and TASB, New York OGS, Texas DIR and Virginia's eVA. TIPS and Axia do not publish volume, so those two are PriceReporter estimates based on channel activity we see. The operating figures — volume, order mix, award pace and channel share — come from our own systems, which is why they are reported here in aggregate.
Frequently asked questions
How many GSA contracts does PriceReporter win per year?
Averaged across the past five years, more than 40 IDIQ contracts and more than 20 BPAs a year: 20+ standard MAS offers, 10+ Streamlined offers, 5+ VA Federal Supply Schedule contracts, 3–4 joint ventures and 20+ BPAs across federal programs — roughly one award every seven to ten days.
How many MRFS2 BPA awardees are PriceReporter clients?
More than half of the companies holding a position on the $1.3 billion, five-year GSA MRFS2 BPA are PriceReporter clients, including companies that PriceReporter carried through the transition from MRFS Generation 1.
How much federal business runs through the PriceReporter order management system?
More than $1.5 billion in federal and SLED order value in 2026 to date, more than 1 million orders a year, and over $4 million on an ordinary day — rising sharply through the August–September fiscal year-end.
Who are PriceReporter's clients?
More than 1,000 companies (the 1,000 mark was crossed in 2024), predominantly small businesses — roughly one large business for every ten small ones — including eight Fortune 500 companies. Clients sell medical and surgical supply, office and facility products, industrial MRO, laboratory and scientific equipment, IT hardware, tactical and troop support items and professional services.
When does the federal government buy the most?
August and September carry more than 25% of annual dollar volume, every year for the past five years. The federal fiscal year closes September 30 and unobligated funds do not carry forward, so a quarter of the year's business lands in a sixth of its days.
Which systems does the PriceReporter OMS integrate with?
50+ live connections: 15 order-receiving modules (DLA DIBBS, FedMall, GSA Advantage EDI, GSA OMS EDI, IntraMalls, Walmart, Newegg, Overstock, Varis, Magento, Logicblock, TrueCommerce, CSV over FTP, QuickSales, with Amazon Selling Partner API going live), 27 PO-fulfillment modules (Grainger, Ingram Micro, Tech Data, Synnex, ScanSource, MSC Direct, HD Supply, Office Depot, Essendant, S.P. Richards and others) and 10 payment gateways led by PayTrace and Authorize.Net. Accounting is fully integrated and an open API is available.
Where do the numbers in this report come from?
Federal award data is public (SAM.gov, HigherGov, GovTribe and the solicitations themselves). GSA Commercial Platforms Program figures come from GSA's published FY25 highlights. Cooperative and state program figures come from the operators (OMNIA Partners, NASPO ValuePoint, Sourcewell, BuyBoard/TASB, New York OGS, Texas DIR, Virginia eVA); TIPS and Axia are PriceReporter estimates. Operating figures — volume, order mix, award pace, channel share — come from PriceReporter's own systems and are reported in aggregate.
Cite this report
Bogol, S. (2026). 2026 Performance and Capability Report. PriceReporter Inc. https://pricereporter.com/performance-report/
Figures may be quoted with attribution to PriceReporter and a link to this page. All data is aggregate and contains no client-identifying information.

Sergey Bogol — VP of GSA Contract Management Operations, PriceReporter
Sergey joined PriceReporter in 2008, and the company has seen growth year after year since — a result directly attributable to his dedication and professionalism. With his team of project managers and IT professionals, Sergey supervises all of PriceReporter's GSA consulting services: federal market intelligence, government compliance and federal contract schedule administration.
What would these numbers look like applied to your business?
Scale on its own proves very little. What matters is whether the same acquisition work, the same vehicles and the same systems fit the way your company already sells to the government. A GSA specialist will review your position and tell you plainly — including if the answer is "not yet".
- Your current contract positionWhat you hold today, what is compliant, and what is at risk before the next renewal or modification.
- Which vehicles fit your catalogMAS, VA FSS, BPAs like MRFS2 and OS5, DLA FedMall, OASIS+ or SLED cooperatives — and which are not worth your time.
- The gaps worth closing firstA short, ordered list of what to fix — not a proposal to buy everything.