Key Points:
- Price Reporter analyzed GSA Advantage sales data covering product-based Schedules from October 2023 through June 2026.
- FY2025 sales declined 10.95%, while unique orders increased 34.8%, showing a shift toward smaller, more frequent purchases.
- Defense remains a major source of demand, while Veterans Affairs and several civilian agencies recorded notable growth in FY2026 YTD.
- The research draws on Price Reporter’s federal market intelligence expertise, backed by more than 2.5 million federal orders processed.
- GSA Market Analysis by Price Reporter Reveals a Changing Federal Purchasing Environment
- Federal Procurement Trends Show Demand Shifting Across Agencies
- GSA SIN Sales Data Shows Strong Market Concentration
- Federal Year-End Spending Remains a Critical GSA Market Trend
- Price Reporter Federal Market Intelligence Is Built on Real GSA Sales Data
- Price Reporter Brings 20 Years of GSA Market Experience to Federal Market Intelligence
- Explore the Full GSA Advantage Sales Data in the FY2026 Report
Price Reporter has published the FY2026 edition of its Federal Market Intelligence Report, providing an in-depth analysis of GSA Advantage sales data and broader federal procurement data for product-based Schedules. The analysis was conducted by Price Reporter using data processed through the company’s Market Intelligence Platform and covers purchasing activity from October 1, 2023, through June 30, 2026.
The GSA sales data highlights significant changes in federal purchasing activity across the period analyzed. GSA Advantage sales reached $635.6 million in FY2024 and $566.0 million in FY2025, while the number of unique orders increased to 594,298 in FY2025. The federal market intelligence report examines these shifts alongside agency purchasing patterns, product and SIN performance, and other trends shaping the GSA marketplace.
GSA Market Analysis by Price Reporter Reveals a Changing Federal Purchasing Environment
Price Reporter’s GSA market analysis identified a notable change in federal purchasing behavior between FY2024 and FY2025. Total GSA Advantage sales for product-based Schedules declined from $635.6 million in FY2024 to $566.0 million in FY2025, a decrease of 10.95%. At the same time, the number of unique orders increased by 34.8%, from 440,766 to 594,298. Average order value consequently fell from approximately $1,442 to $952.
The early GSA Advantage sales 2026 data presents a somewhat different picture. Through June 30, FY2026 sales totaled $319.0 million, only 0.9% below the comparable October through June period of FY2025. Although unique order volume was 5.8% lower, average order value increased by approximately 5.2% when the same nine-month periods are compared. These GSA purchasing trends suggest that the sharp shift toward smaller, more frequent transactions seen in FY2025 has begun to moderate.
One of the most important findings is that more transactions do not necessarily translate into higher GSA Advantage sales. FY2025 produced substantially more orders but lower total dollar volume. For GSA contractors, this makes order economics increasingly important. Pricing remains critical, but contractors also need to consider processing, payment, fulfillment and other operational costs when handling a larger number of relatively small federal orders.
Price Reporter Comment: The FY2025 data shows why contractors should look beyond total sales when evaluating the GSA market. A growing number of smaller orders can create new opportunities, but it also increases the importance of efficient order processing, fulfillment and cost control.
Federal Procurement Trends Show Demand Shifting Across Agencies
Price Reporter’s analysis also identified changes in where federal demand is coming from. Defense remains central to GSA Advantage agency spending, but the FY2026 YTD data shows a broader distribution of purchasing activity than in previous periods. The Air Force remained the largest buyer at $124.5 million through June 2026, while its share of sales among the ten agencies analyzed declined to approximately 42%.
Veterans Affairs provides the clearest example of meaningful growth at scale. VA generated $48.5 million in FY2026 YTD sales, an increase of 16.8% from the comparable FY2025 period. Several smaller civilian agencies recorded even higher percentage increases, although their dollar volumes remained substantially below those of the largest federal buyers:
- Justice increased 33.1% to $5.7 million.
- Health and Human Services increased 26.1% to $7.1 million.
- Commerce increased 24.8% to $3.5 million.
- Energy increased 22.3% to $3.1 million.
- Veterans Affairs increased 16.8% to $48.5 million.
These federal procurement trends do not indicate that defense demand has been displaced. The Air Force remains far ahead of other individual buyers, while the Navy, Army and Defense (OSD) continue to represent substantial sources of GSA Advantage demand. Instead, the GSA sales data points to a market in which selected civilian agencies are contributing more meaningfully to the overall demand picture.
For contractors evaluating federal agency spending, the distinction between percentage growth and actual purchasing volume is important. Justice posted the highest percentage increase among the agencies analyzed, for example, but its $5.7 million FY2026 YTD volume remained far below VA’s $48.5 million. Federal government spending trends therefore need to be assessed in terms of both growth rates and the size of the underlying market.
GSA SIN Sales Data Shows Strong Market Concentration
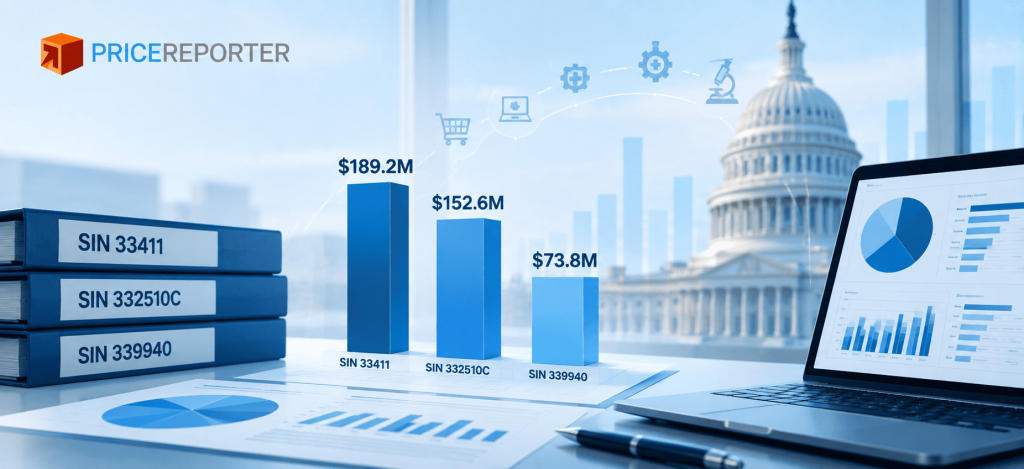
The GSA SIN sales data analyzed by Price Reporter shows that purchasing activity is highly concentrated in a small number of categories. Between January 1, 2025 and June 30, 2026, SIN 33411 generated $189.2 million in sales, while SIN 332510C generated $152.6 million. Together, these two SINs represented approximately 42% of sales recorded during the period covered by the SIN analysis.
SIN 339940 ranked third with $73.8 million, followed by a substantial decline in sales across the remaining categories. Rather than reproducing the full ranking of the top GSA SINs from the Federal Market Intelligence Report, the figures below illustrate the concentration at the top of the market.
| GSA SIN | Category | Sales, Jan. 2025 to Jun. 2026 |
| 33411 | Purchasing of new electronic equipment | $189.2M |
| 332510C | Hardware, home improvement, industrial/general supply or MRO catalog | $152.6M |
| 339940 | Office products | $73.8M |
GSA Advantage product sales show a similar concentration in technology. Twelve of the 15 top-selling products identified by Price Reporter were computing or display products. HP and Samsung together accounted for approximately 81% of sales among those 15 products, with the HP 8L3N0AV laptop ranking first at $8.2 million.
At the same time, the data shows that demand is not limited to IT. Medical and therapeutic equipment also appears among the top-selling products on GSA Advantage, while other leading SINs cover office products, MRO supplies, law enforcement equipment, furniture, laboratory supplies and additional categories. This distinction is important because high concentration among the leading products does not mean federal demand as a whole is confined to a small number of product types.
Federal Year-End Spending Remains a Critical GSA Market Trend
Seasonality is another clear pattern identified in Price Reporter’s analysis. July through September was the strongest quarter in both completed fiscal years covered by the report, with a pronounced increase in purchasing activity near the end of September. This federal year-end spending pattern makes the final quarter of the fiscal year particularly important for contractors selling through GSA Advantage.
FY2026 followed a less consistent path during its first nine months. October and November began below the previous two fiscal years, but purchasing activity subsequently recovered. March 2026 GSA Advantage sales were 72.9% higher than in March 2025, while June sales were 8.2% higher year over year. By June 30, cumulative FY2026 sales had reached $319.0 million.
The FY2026 figures do not yet include July, August or September, so they cannot show whether the established federal Q4 spending pattern will repeat for the full fiscal year. The report is scheduled to be updated with complete FY2026 data after the fiscal year closes.
For contractors, historical federal fiscal year spending patterns have practical implications. Preparation for the purchasing peak needs to take place before demand accelerates. Areas that may require advance attention include:
- ensuring GSA Advantage catalogs are accurate and current;
- reviewing contract pricing before the federal Q4 spending period;
- confirming inventory and product availability;
- preparing order processing and fulfillment capacity for higher transaction volumes;
- resolving catalog or contract issues before the year-end purchasing surge begins.
These GSA spending trends reinforce the importance of entering the final quarter with the operational work already completed rather than reacting after federal purchasing activity has increased.
Price Reporter Comment: Federal year-end demand can create significant opportunities, but contractors need to prepare before the purchasing surge begins. Catalog accuracy, competitive pricing, inventory availability and fulfillment capacity should be addressed well ahead of the final months of the fiscal year.
Price Reporter Federal Market Intelligence Is Built on Real GSA Sales Data
The Federal Market Intelligence Report is based on an analysis conducted by Price Reporter rather than a compilation of general observations about the federal marketplace. The study covers GSA Advantage sales for product-based Schedules from October 1, 2023 through June 30, 2026, using data processed through Price Reporter’s Market Intelligence Platform.
The methodology also separates time periods where necessary to avoid misleading comparisons. FY2026 figures are year-to-date through June 30, so Price Reporter calculates FY2026 year-over-year changes by comparing October through June with the same months of FY2025 rather than comparing nine months of activity with a completed fiscal year. SIN and product rankings use a separate analysis period from January 1, 2025 through June 30, 2026.
This approach provides several layers of federal procurement data within the same research framework, including GSA Advantage sales data by fiscal period, federal agency, SIN, product and month. It allows the report to examine not only how much is being purchased, but also where demand is concentrated and how purchasing patterns are changing over time.
Price Reporter Brings 20 Years of GSA Market Experience to Federal Market Intelligence
Price Reporter was founded in 2006 to help companies establish and grow their business with the federal government. Over the past 20 years, the company has expanded beyond GSA consulting into contract management, technology, order management and federal market intelligence.
The scale of Price Reporter’s work provides an operational foundation for its GSA market analysis. The company’s current experience includes:
- more than 1,000 companies served;
- more than 1,500 GSA contracts under management;
- more than 500 GSA contracts awarded;
- more than 20,000 GSA contract modifications completed;
- more than 2.5 million federal orders processed;
- item-level GSA pricing data delivered to clients since 2009.
Price Reporter works across multiple stages of the GSA contract lifecycle, including contract acquisition, negotiations, contract management, catalog maintenance, compliance, modifications and order management. Its technology infrastructure includes tools for processing federal orders and analyzing market and pricing information.
This combination of GSA consulting and technology is also central to the company’s approach to GSA market intelligence. Price Reporter works with the operational side of federal contracting while its Market Intelligence Platform provides data for analyzing purchasing behavior, competitive pricing and market activity. The Federal Market Intelligence Report therefore extends a broader data-driven approach already used across the company’s GSA contract and order management operations.
Explore the Full GSA Advantage Sales Data in the FY2026 Report
The complete Federal Market Intelligence Report provides access to the underlying GSA Advantage sales data in greater detail, including federal agency data, GSA SIN rankings, product-level results and monthly sales analysis. The GSA sales report is also available in downloadable PDF and CSV formats, allowing contractors, analysts and other federal market participants to examine the findings beyond the summary presented here. Price Reporter permits the report’s data and charts to be reused with attribution to Price Reporter and a link to the original research.
Published by Price Reporter, a GSA consulting and federal market intelligence company founded in 2006, the report is part of the company’s broader work helping more than 1,000 businesses establish and grow their government business. With more than 1,500 GSA contracts under management, 20,000 contract modifications completed and 2.5 million federal orders processed, Price Reporter combines hands-on GSA experience with market intelligence and technology to help contractors better understand and operate within the federal marketplace.